Guide · QA + AI series · 26/31 · November 13, 2026 · 7 min read
Performance (2): load testing an LLM endpoint with k6
A staged load test against an LLM endpoint, with token and goodput metrics, to find the point where the system stops scaling.
With yesterday's baseline and targets you can now ask the question that matters to whoever operates the system: how many users it supports before the experience degrades. The answer is a curve with a breaking point, and finding it requires loading gradually and watching the right metrics.
k6 works well for this. Scripts are code, they run locally and in CI, and thresholds turn the test into a pass or fail criterion. But a load test against a model has traps of its own: caching that flatters the results, provider quota limits that look like saturation and default timeouts that cut long answers off. This guide builds the test while avoiding those three.
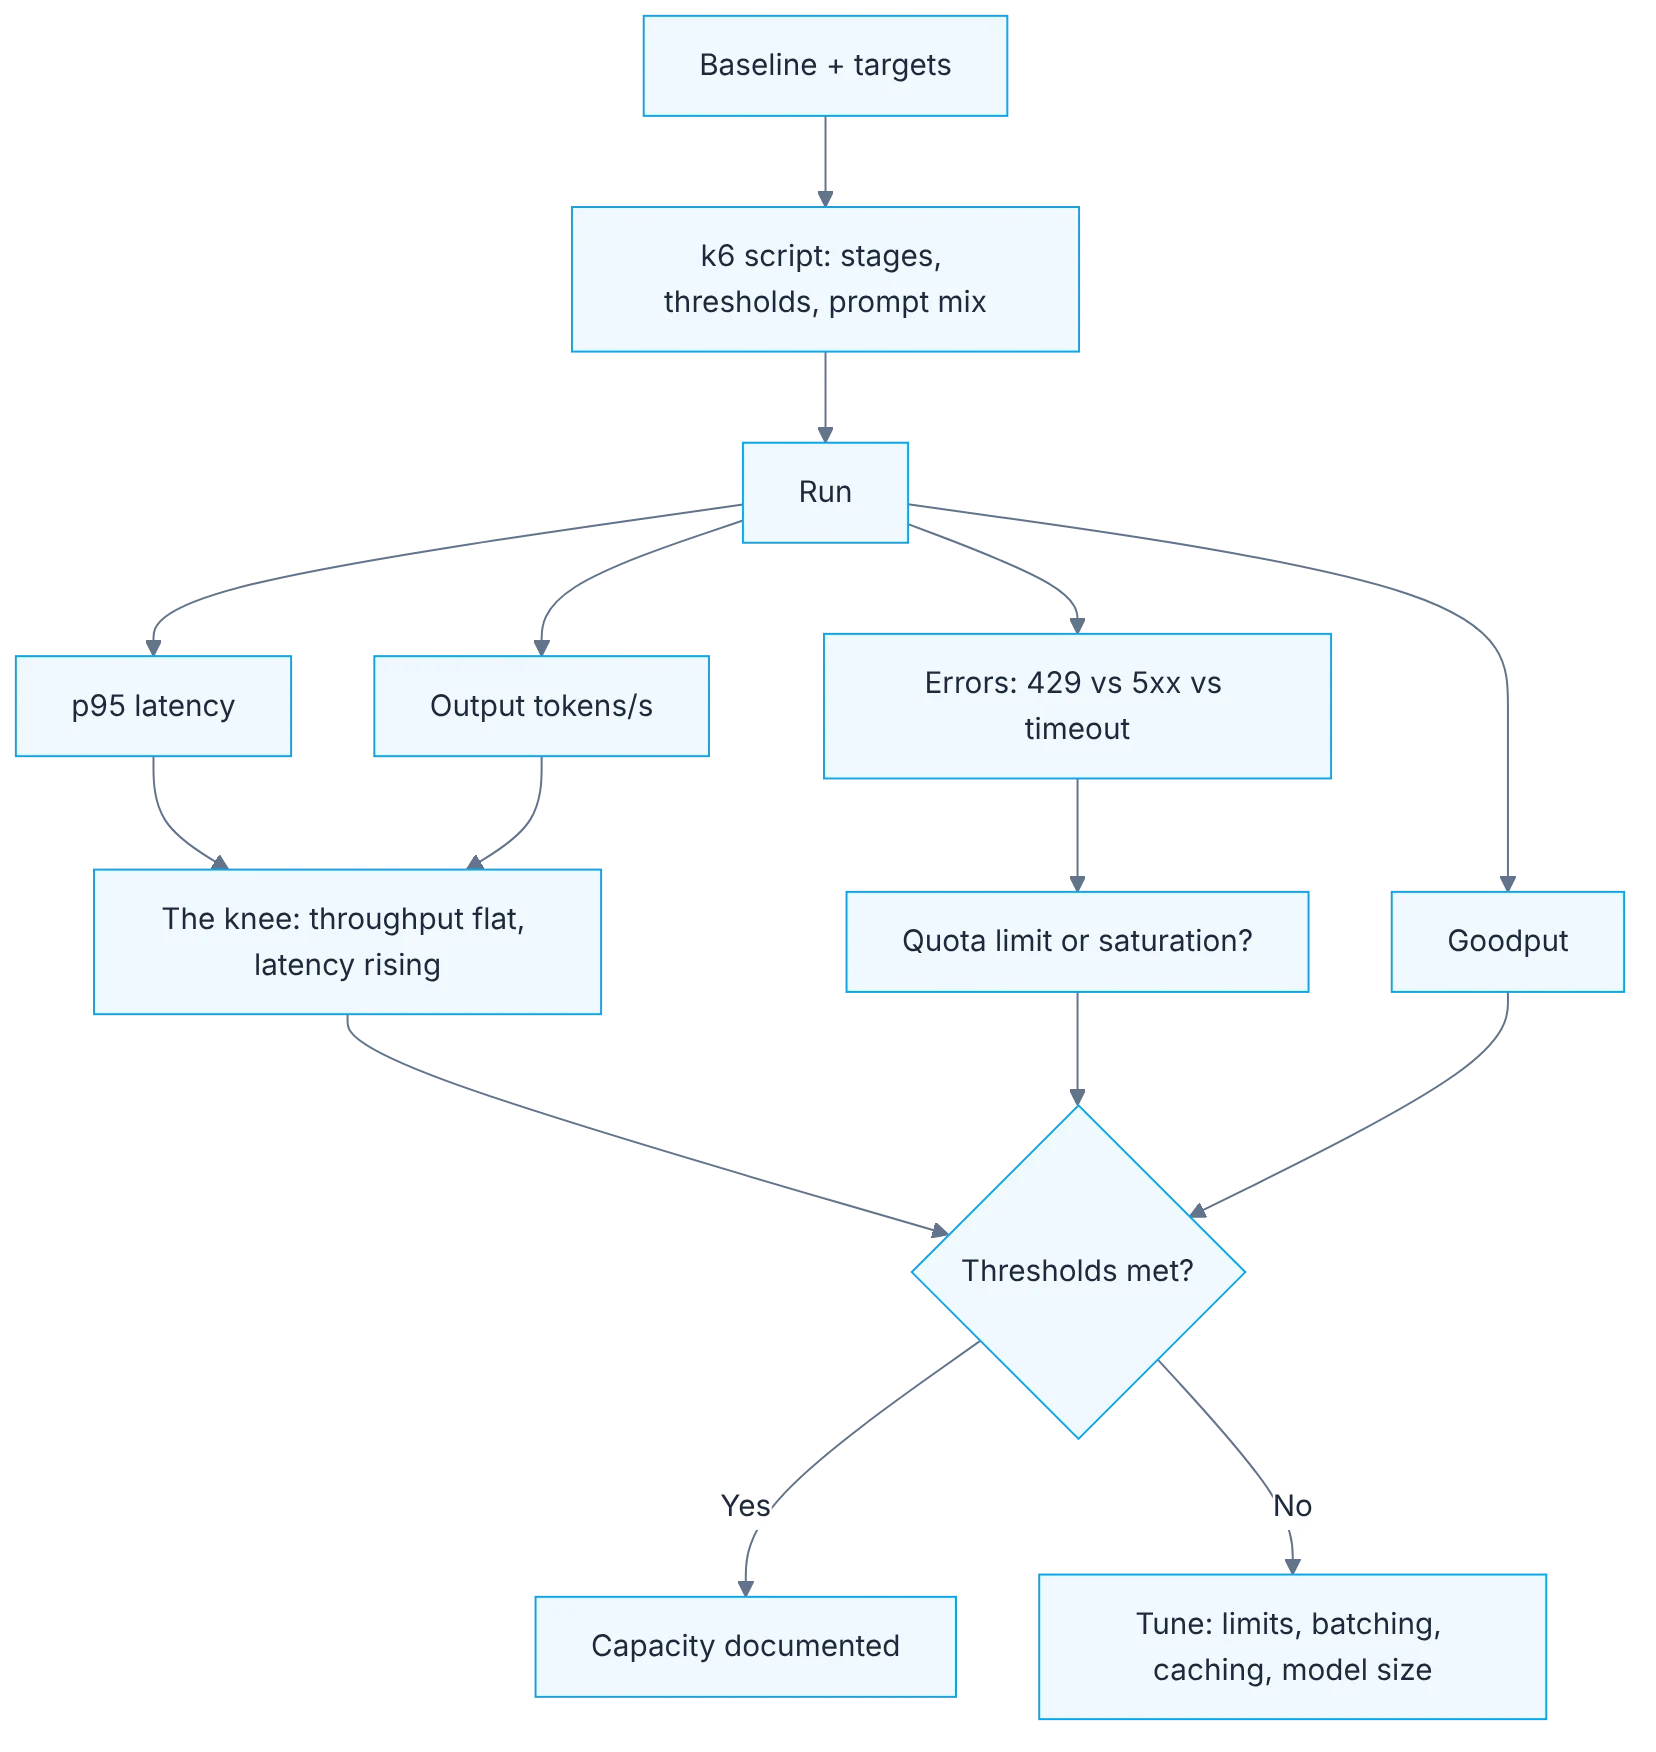
How it fits together
Show the diagram as text
baseline + targets ▶ k6 script (stages + thresholds + prompt mix) ▶ run
   ├─ p95 latency ──────────────┐
   ├─ output tokens/s ──────────┴─▶ the knee: throughput flat, latency rising
   ├─ errors: 429 vs 5xx vs timeout ─▶ quota limit or saturation?
   └─ goodput
   ▼
thresholds met?
   ├─ yes ▶ capacity documented
   └─ no  ▶ tune: limits, batching, caching, model size
Requirements
- k6 installed.
- An OpenAI-compatible endpoint and the day 25 targets.
- Approved budget if the API is paid: cap
max_tokens, duration and users. - k6 doesn't natively measure streaming: TTFT under load needs an SSE extension or an LLM-specific tool.
Setup
import http from "k6/http";
import { check } from "k6";
import { Trend, Rate } from "k6/metrics";

const tokensPerSec = new Trend("output_tokens_per_sec");
const goodput = new Rate("goodput");

export const options = {
  stages: [
    { duration: "1m", target: 5 },
    { duration: "3m", target: 5 },
    { duration: "1m", target: 20 },
    { duration: "3m", target: 20 },
    { duration: "1m", target: 0 },
  ],
  thresholds: {
    http_req_duration: ["p(95)<8000"],
    http_req_failed: ["rate<0.01"],
    goodput: ["rate>0.95"],
  },
};

const prompts = [
  "Summarize in 80 words why flaky tests hurt CI.",
  "List 5 boundary cases for a date-of-birth field.",
  "Explain in 100 words what a contract test is.",
];

export default function () {
  const res = http.post(
    __ENV.BASE_URL + "/v1/chat/completions",
    JSON.stringify({
      model: __ENV.MODEL,
      messages: [
        { role: "user", content: prompts[Math.floor(Math.random() * prompts.length)] },
      ],
      max_tokens: 200,
    }),
    {
      headers: {
        "Content-Type": "application/json",
        Authorization: "Bearer " + __ENV.API_KEY,
      },
      timeout: "60s",
    }
  );
  const ok = check(res, { "status 200": (r) => r.status === 200 });
  if (ok) {
    const outTokens = res.json("usage.completion_tokens");
    tokensPerSec.add(outTokens / (res.timings.duration / 1000));
  }
  goodput.add(ok && res.timings.duration < 8000);
}BASE_URL=http://localhost:11434 MODEL=llama3.2 API_KEY=local k6 run perf/load.jsStep by step
1. Thresholds from the targets
Start from the day 25 baseline and written targets. The script's thresholds come from there.
The script's thresholds are the targets you wrote yesterday, translated into code: the ninety-fifth percentile of time to first token, that of total latency and the maximum error rate. Don't invent them while writing the script or accept whatever an example brings. A threshold with no origin is decoration: nobody knows what it means when it fails. With product targets as thresholds, a red result means users will have a worse experience than agreed.
2. A realistic prompt mix
Use a prompt mix similar to the real one. With a single repeated prompt, caching gives you numbers production won't see.
Load prompts from a file with the workload profile's mix: types and proportions. If you repeat a single prompt, two things happen. The provider's cache or your own application's answers far faster than in real use, and numbers come out better than production will see. Also, all answers have the same length, and you lose the variability that stresses the system. Use enough different prompts that they don't repeat during the test.
3. Load in stages
Load in stages: ramp, hold, ramp again. Plateaus are where you read behavior.
Raise load in steps: ramp to a level, hold it for a few minutes, ramp to the next. Plateaus are where you read behavior, because the system had time to stabilize. During ramps the numbers blend two states. Hold each plateau long enough to complete the profile's longest request several times. If a long answer takes forty seconds, a one-minute plateau barely manages to show one round.
4. Finding the knee
Look for the knee: the point where total tokens per second stop growing and latency starts climbing. That's your capacity.
Plot total tokens per second and latency for each plateau. At first, more users produce more tokens per second with stable latency. At some point tokens per second stop growing and latency starts climbing. That's the knee, and it marks the system's real capacity. Beyond that point each additional user only makes the others wait longer. Your usable capacity sits a little below it, with headroom for peaks.
5. Separating errors
Separate errors: 429 is the provider's rate limit; 5xx and timeouts are saturation. They get fixed differently.
Not all errors mean the same. A 429 is the provider's quota limit: you reached the maximum requests or tokens per minute your account allows, and it's solved by requesting more quota or adding a queue with retries. A 5xx or a timeout is saturation, of your infrastructure or the provider's, and it's solved with capacity or by reducing work per request. Count them separately in the script. Blended into a single error rate, they lead to the wrong fix.
6. Thresholds as the criterion and scheduled runs
Keep thresholds as the pass or fail criterion and run the test on a schedule, not on every PR.
Keep thresholds as the automatic pass or fail criterion, so the test can run without someone interpreting charts each time. Schedule it periodically or before each release, not on every pull request: it's slow, costs money if you use a paid API and needs a stable environment to be comparable. Save each run's summary. The trend of the knee over time warns you of a degradation before it becomes an incident.
Illustrative example
With illustrative figures: a team loads its assistant in plateaus of five, ten, twenty and forty users, three minutes each, with fifty different prompts. Up to twenty users, tokens per second grow almost proportionally and the ninety-fifth percentile of latency holds at nine seconds. With forty, tokens per second stay the same as with twenty and latency rises to twenty-two seconds. The knee is around twenty. In the last plateau errors appear. Separating them, almost all are 429s. It isn't model saturation but the account's quota limit. The right action is managing quota and adding a queue, not adding servers.
Common mistakes
- Repeating a single prompt and measuring the cache instead of the system.
- Raising load in a single ramp with no plateaus.
- Adding 429s and 5xxs into a single error rate.
- Leaving the default timeout and cutting long answers off.
Checklist: how to know it is done
- The script's thresholds match the written targets.
- Prompts come from a file with the profile's mix.
- The test has plateaus and you located the knee.
- 429 errors are counted apart from 5xxs and timeouts.
Where AI fell short
Generated scripts often come with no timeout, no prompt mix and made-up thresholds. Review them against your targets before running.
Frequently asked questions
Can I load test a provider's API?
Check its terms and your quota limits first. What you measure in that case is mostly your quota and your own application, not the provider's capacity. Use a dedicated key with a spending cap and estimate the test's cost.
Does k6 measure time to first token?
With streaming it has to be measured explicitly in the script, recording when the first chunk arrives. If your tool doesn't support it directly, measure it on the server side with traces and cross-reference data from the same window.
How long should the test last?
Long enough for each plateau to complete the longest request several times. To detect problems that appear over time, such as memory leaks or growing queues, add a longer soak test at moderate load.
Day 26 of 31 of the 31 days of QA + AI series. Commands and versions reviewed in November 2026: rerun them before relying on them, AI tooling changes fast.
← Previous: A model for performance testing (1): the metrics that matter for an LLM
Next: Performance (3): AI generating and analyzing load tests →