Guide · QA + AI series · 27/31 · November 13, 2026 · 6 min read
Performance (3): AI generating and analyzing load tests
How to use an LLM to write a load script from a specification and to propose hypotheses about the results, with a method to verify each.
Writing a load script from scratch and later reading a summary with hundreds of metrics are the two slowest parts of performance testing, and both are text. A model can speed both up. What it can't do is know what your traffic looks like, what your targets are or what was happening on your servers during the test.
If you don't give it that information, it fills it in with reasonable values and presents them confidently. The resulting script runs, and tests a load that isn't yours. The resulting analysis sounds expert, and describes generic bottlenecks. This guide shows which inputs make AI useful in performance, how to review what it generates before spending a run and how to turn its analysis into hypotheses that get verified.
How it fits together
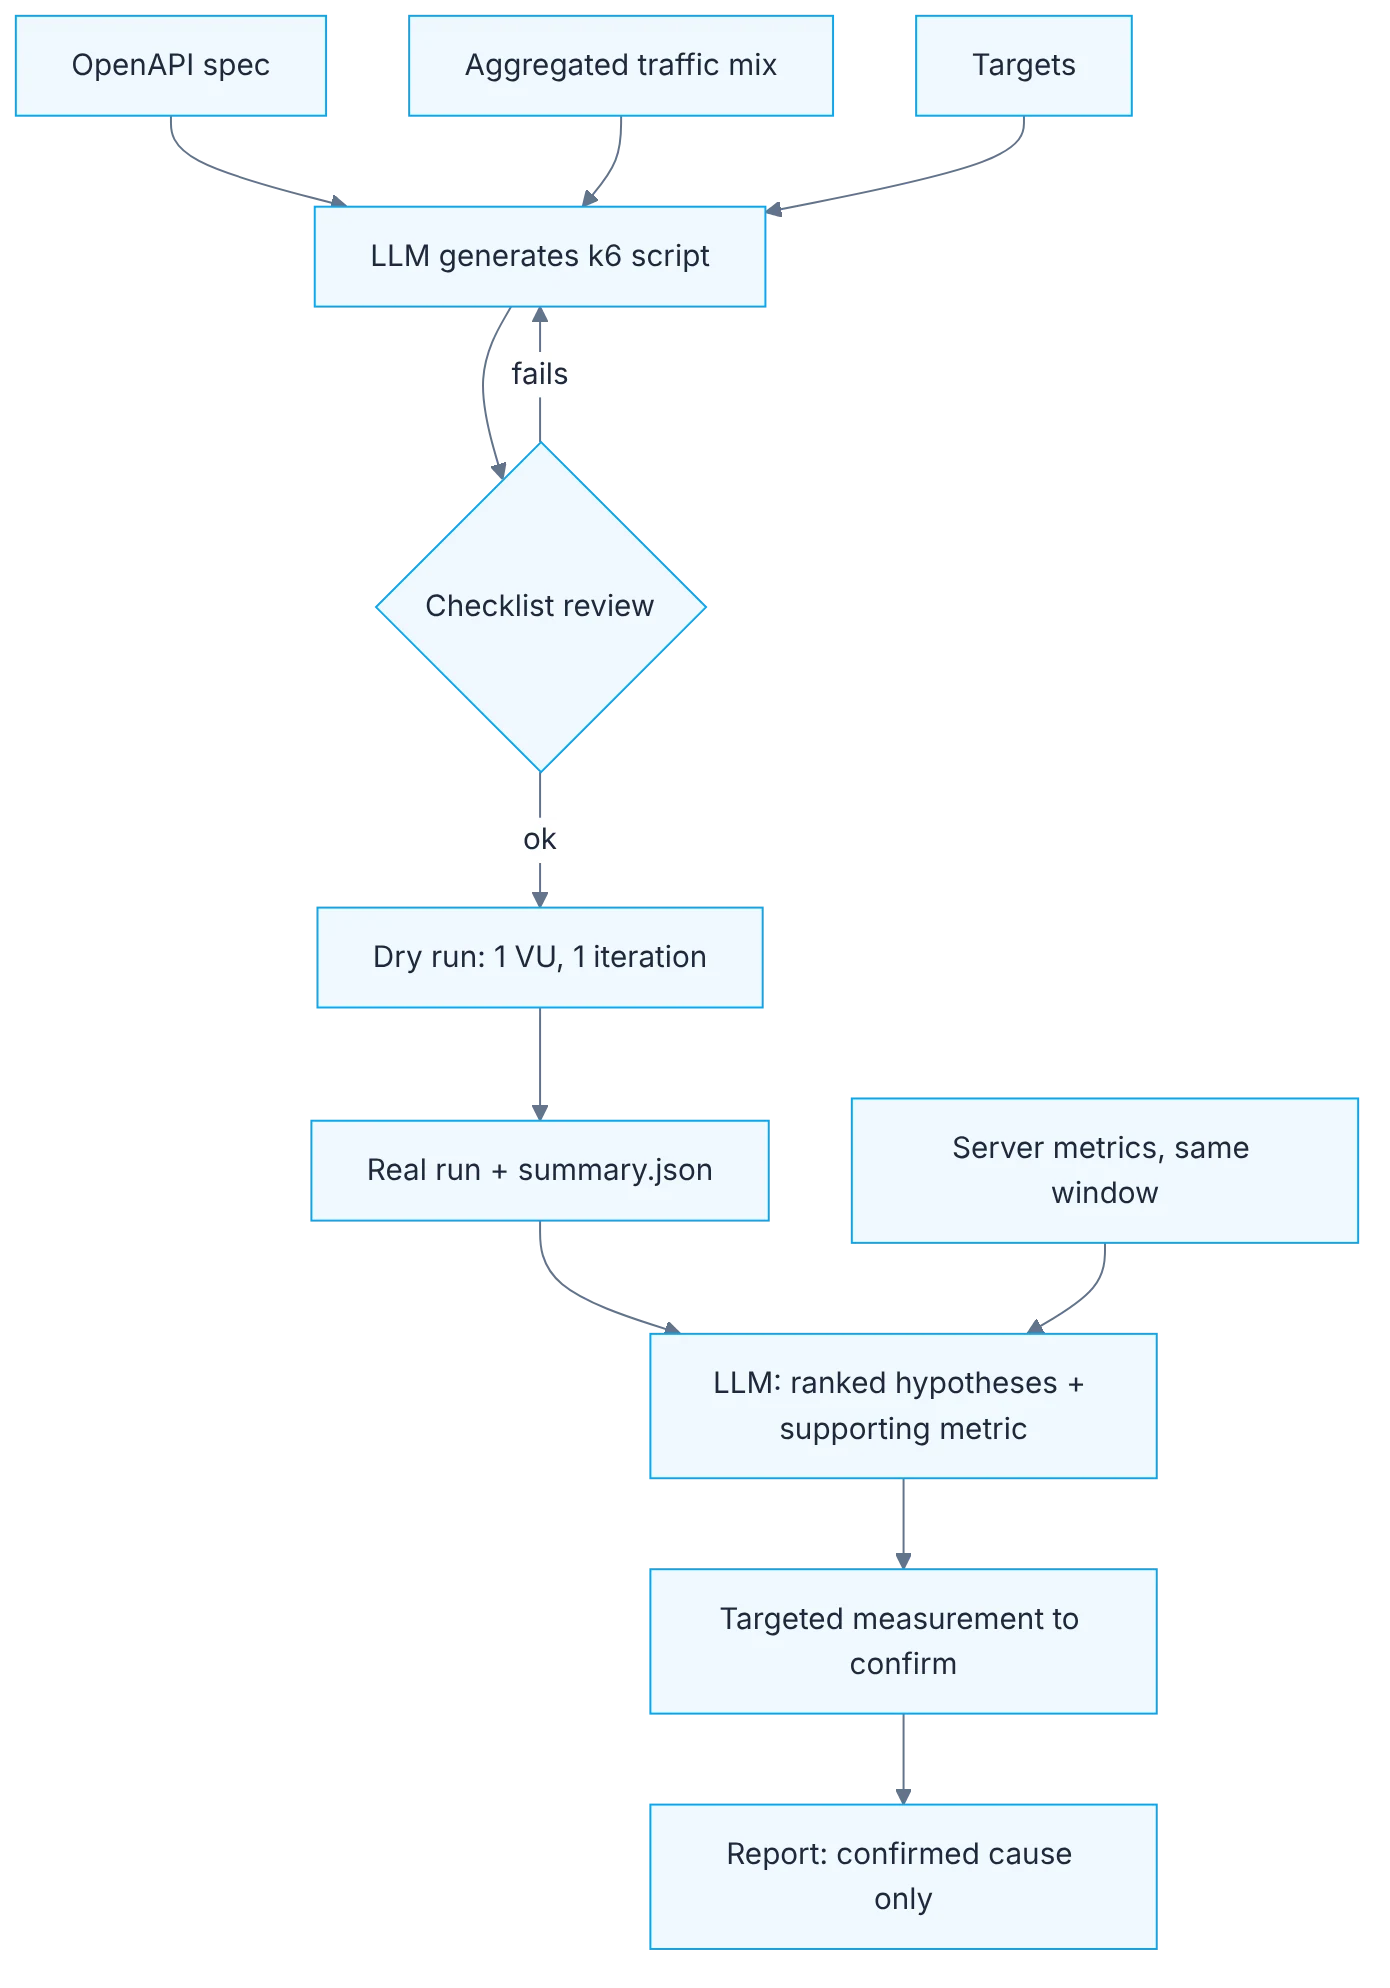
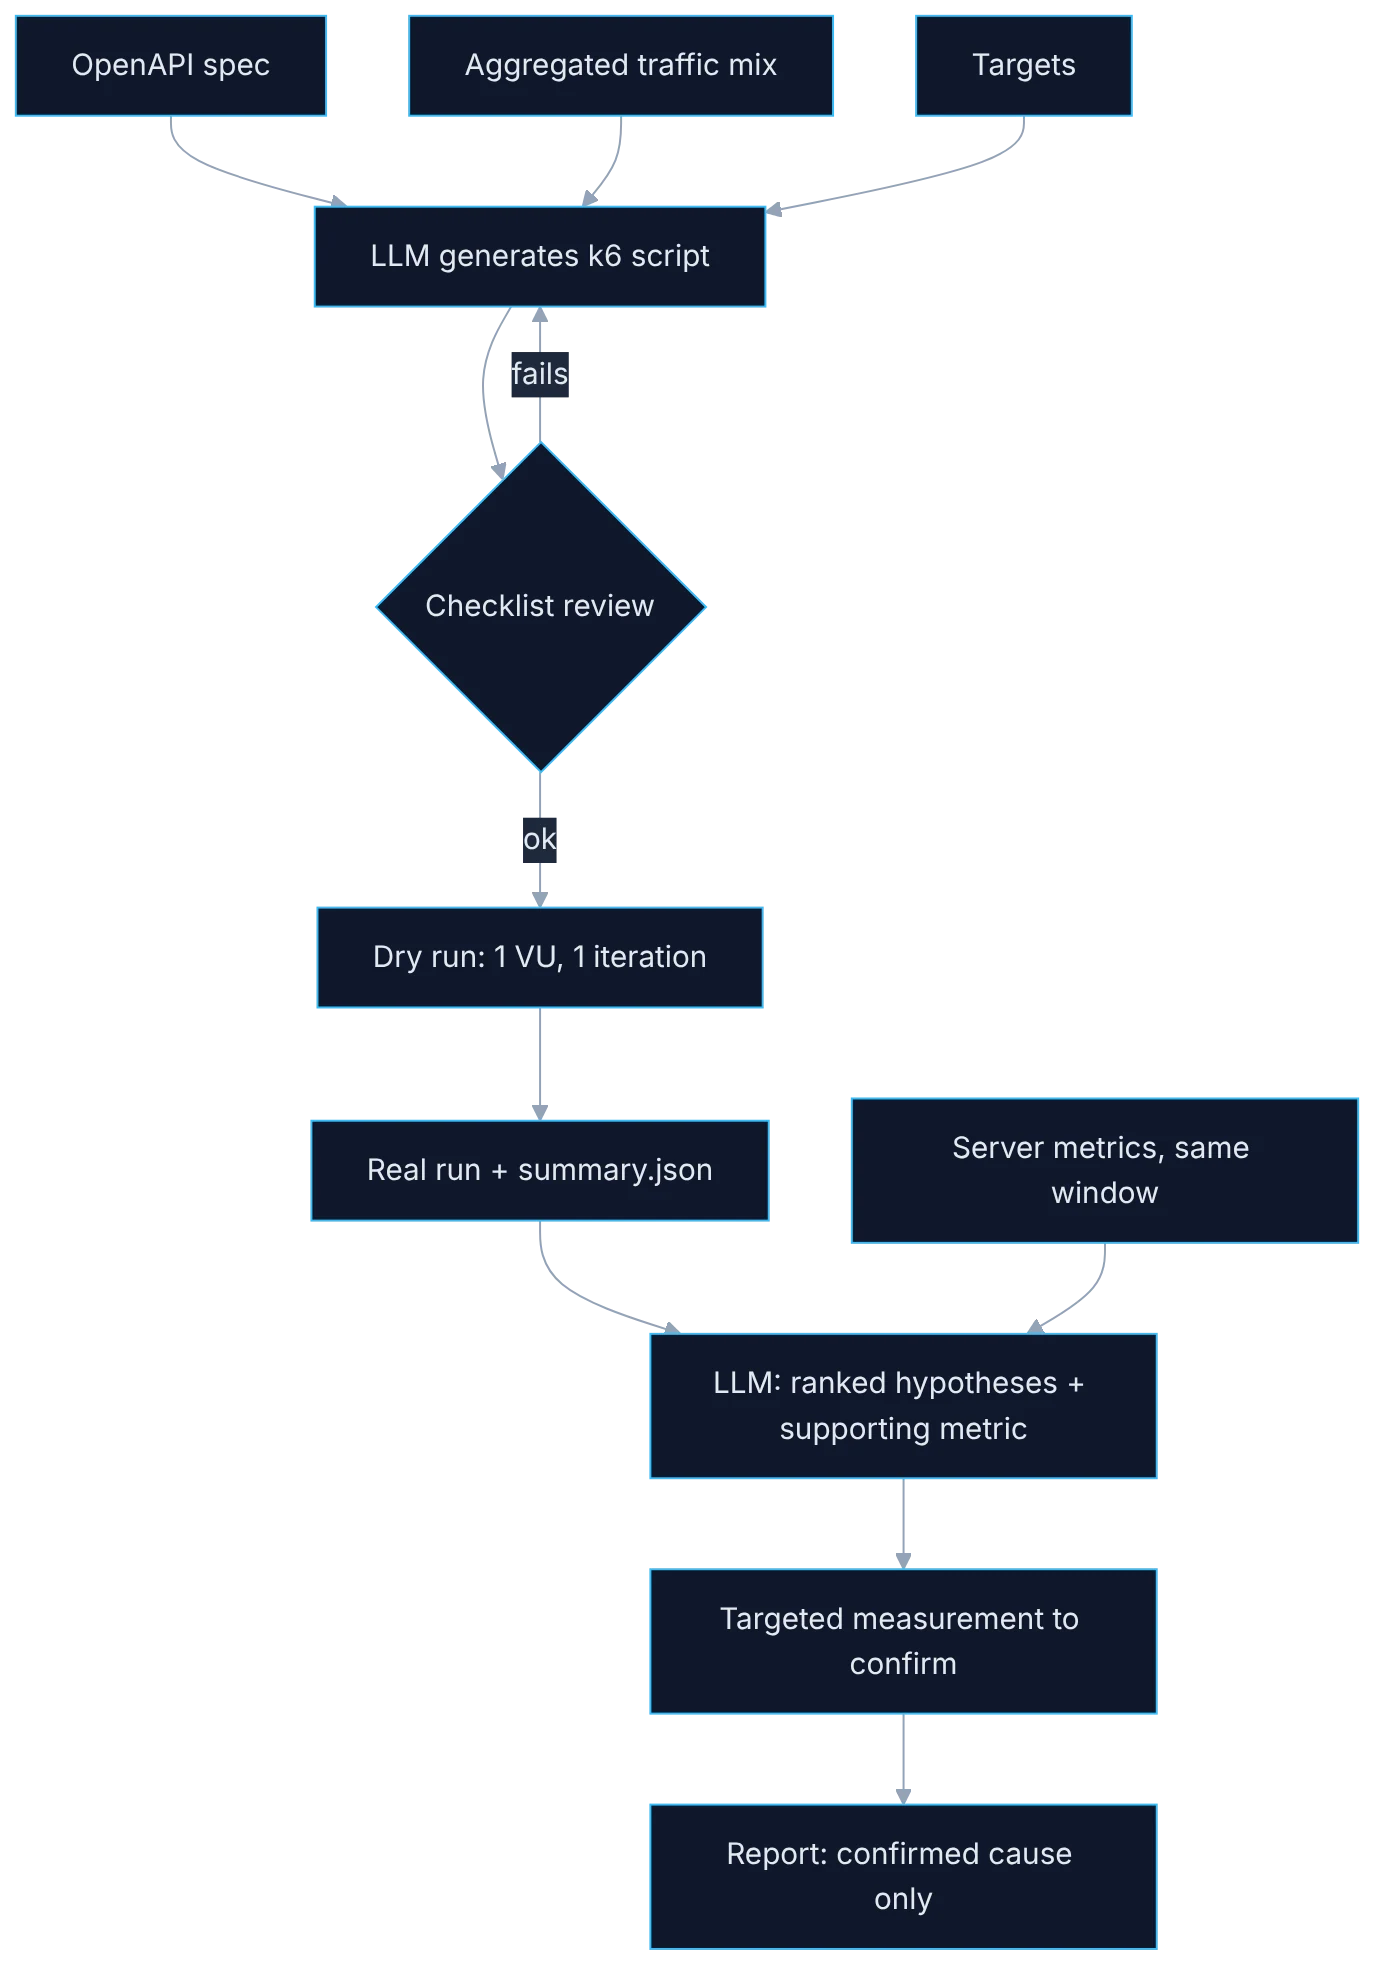
Show the diagram as text
OpenAPI spec ───────────┐
aggregated traffic mix ─┼─▶ LLM generates k6 script ▶ checklist review ▶ dry run (1 VU)
targets ────────────────┘                                                    ▼
                                                              real run + summary.json
server metrics (same window) ──────────────────────────────────────────────▶ │
                                                                             ▼
                                             LLM: ranked hypotheses + supporting metric
                                                                             ▼
                                                  targeted measurement to confirm
                                                                             ▼
                                                     report: confirmed cause only
Requirements
- k6 and a practice API with an OpenAPI spec.
- An aggregated traffic profile (percentage per endpoint), never raw logs with personal data.
- Written service targets.
Setup
Write a k6 script for the API in this OpenAPI spec.
Traffic mix: 60% GET /products, 30% GET /products/{id}, 10% POST /cart.
Targets: p95 < 500 ms, error rate < 1%.
Requirements: scenarios matching the mix, think time between 1 and 3 s,
test data from a file (no repeated IDs), base URL and token from environment
variables, thresholds from the targets, explicit timeouts. No hardcoded secrets.k6 run --vus 1 --iterations 1 perf/generated.js # dry run
k6 run --summary-export=summary.json perf/generated.jsHere is the k6 summary and the server metrics for the same window
(CPU, memory, DB connections, queue depth).
Propose up to 3 hypotheses for the bottleneck, ranked. For each one: the metric
that supports it, what would contradict it, and one extra measurement that would
confirm it. Do not state a cause as fact.Step by step
1. Three required inputs
Give the model three inputs: the API spec, the aggregated traffic mix and the targets. Without them it invents all three.
The model needs three things to write a useful script. The API spec, to know the real endpoints, parameters and formats. The aggregated traffic mix, meaning what percentage of calls goes to each operation, taken from your logs with no user data. And the latency and error targets. If any of the three is missing, it will invent it. And it will do so plausibly, which is worse than doing it badly: an invented traffic mix doesn't look different from a real one.
2. Explicit requirements in the request
Request the script with explicit requirements: scenarios, think time, data from a file, environment variables, thresholds and timeouts.
Ask for the script with a list of requirements, not a general description: scenarios split by operation type, think time between actions of the same user, data read from a file, URLs and keys through environment variables, thresholds with your targets and timeouts suited to answer length. Each requirement corresponds to a frequent defect in generated scripts. Save the request as a template in the repo, just like the prompts from earlier days.
3. Review with a checklist
Review it with a checklist before running: does the mix match? is there think time? is data non-repeating? zero secrets in code? are the thresholds yours?
Before running anything, review the script with five questions. Does the scenario mix match the one you passed? Is there think time between actions, or does each virtual user fire without pause? Does data vary, or is the same record repeated? Is any secret written in the code? Are the thresholds yours, or did others appear? That's five minutes of reading. Running a wrong script costs an hour of testing, API budget and, above all, conclusions drawn from data that represents nothing.
4. Dry run and real run
Dry run with one user and one iteration to confirm it works, then the real run exporting the summary.
Run first with one user and one iteration. It confirms the script works: that it authenticates, that responses are the expected ones and that checks pass. Finding an authentication error with a thousand virtual users is an expensive way to find out. Only then launch the real run and export the summary to a file. That file, together with the exact time window of the test, is the input for the next step.
5. Analysis with server metrics
For analysis, pass the summary along with server metrics from the same window. Ask for ranked hypotheses, with the supporting metric and how to confirm each.
For analysis, give the model the test summary together with server metrics from the same window: CPU, memory, database connections, queue length, GPU usage if applicable. Ask for hypotheses ranked by likelihood, each with the supporting metric and the way to confirm it. That format forces it to cite data instead of listing typical causes. A hypothesis that doesn't name a metric from your data gets discarded without further analysis.
6. Verify the top hypothesis
Verify the top hypothesis with a targeted measurement. An unconfirmed bottleneck is a suspicion.
Take the top-ranked hypothesis and design a targeted measurement to confirm or discard it. If it says the bottleneck is the connection pool, repeat the test with a larger pool and see whether the knee moves. If it doesn't move, the hypothesis was wrong and you move to the next. Until a measurement confirms it, a bottleneck is a suspicion. Reporting it as a finding without verifying gets the team optimizing something that wasn't the problem.
Illustrative example
A team asks a model for a script for its API with the spec, the traffic mix and the targets. The checklist review finds two problems: there's no think time between actions and the latency threshold is five hundred milliseconds, when their target was two seconds. They fix both. The dry run passes. The real run shows a knee at one hundred and twenty users. For analysis they hand over the summary and the server metrics. The top hypothesis: the database connection pool is exhausted, because active connections hit the maximum exactly when latency rises. They enlarge the pool, repeat, and the knee moves to one hundred and eighty. Hypothesis confirmed, with illustrative figures.
Common mistakes
- Asking for the script without spec, traffic mix or targets.
- Running the generated script without reviewing it against the checklist.
- Asking for analysis with only the load tool's summary.
- Reporting an unverified hypothesis as the bottleneck.
Checklist: how to know it is done
- The request includes spec, traffic mix and targets.
- The script passed the five-question checklist.
- There was a dry run before the real run.
- The top hypothesis was confirmed or discarded with a measurement.
Where AI fell short
Without server metrics, it confidently diagnoses generic causes. The analysis is worth what the data you feed it is worth.
Frequently asked questions
Can I paste production logs to get the traffic mix?
Pass only the aggregates: number of calls per operation and, if needed, the size distribution. Raw logs tend to carry identifiers, tokens and personal data. Compute the percentages with a query and hand over the resulting table.
Does it work with tools other than k6?
The method is the same with any code-based load tool: three inputs, explicit requirements, checklist, dry run and analysis with server data. The script's syntax changes, not the process.
What do I do if I have no server metrics?
Get them before asking for an analysis. Without them, the summary only says the system got slow, not why. A basic panel with CPU, memory and connections from the same window is already enough to start.
Day 27 of 31 of the 31 days of QA + AI series. Commands and versions reviewed in November 2026: rerun them before relying on them, AI tooling changes fast.
← Previous: Performance (2): load testing an LLM endpoint with k6