Guide · QA + AI series · 25/31 · November 13, 2026 · 8 min read
A model for performance testing (1): the metrics that matter for an LLM
The performance model of an LLM feature: workload profile, text-generation-specific metrics and percentile targets.
Someone coming from traditional performance testing arrives at an endpoint with a model and applies what they know: requests per second, average latency and error rate. The numbers come out, and they describe the system poorly. Two requests to the same endpoint can generate twenty tokens or two thousand, and take half a second or forty. Averaging them blends things that aren't alike.
A model's unit of work is the token. The user's experience depends on when the first one arrives and on how smoothly the rest follow. This guide introduces the metrics that describe that, how to define targets per percentile and how to measure a single-user baseline. Without that baseline, any later load test is a number with no reference.
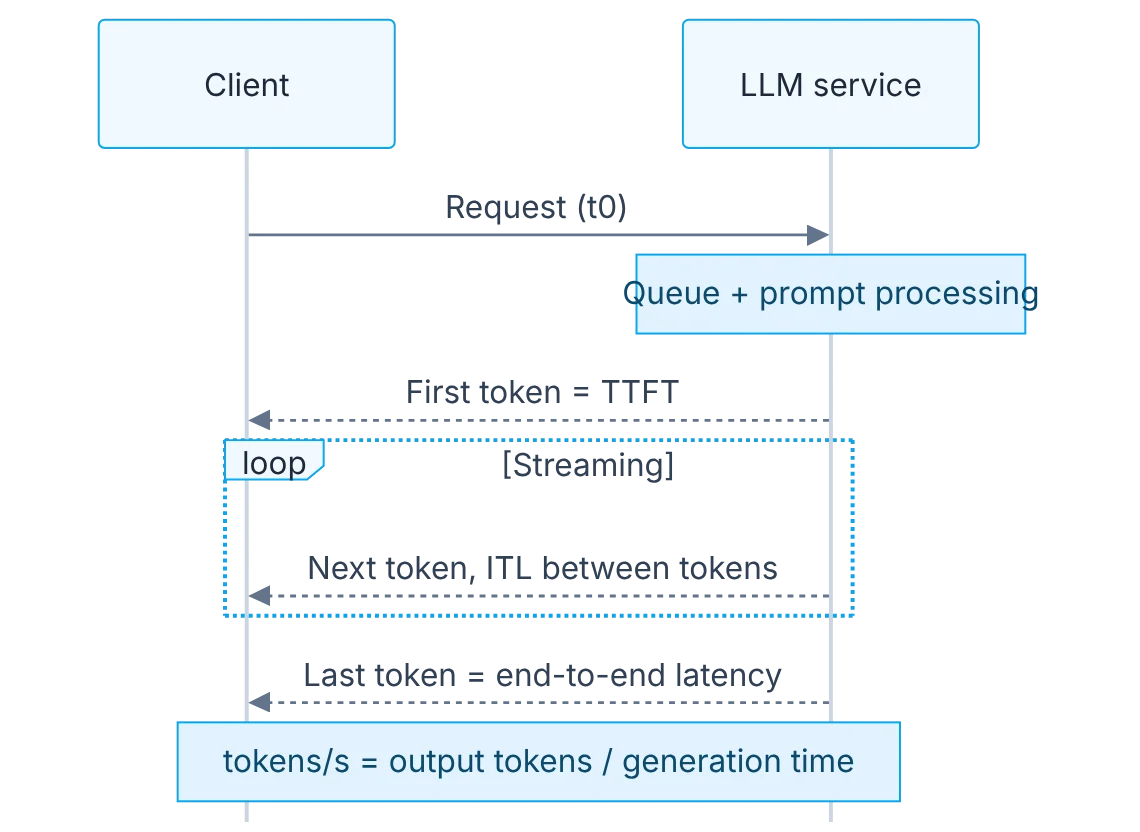
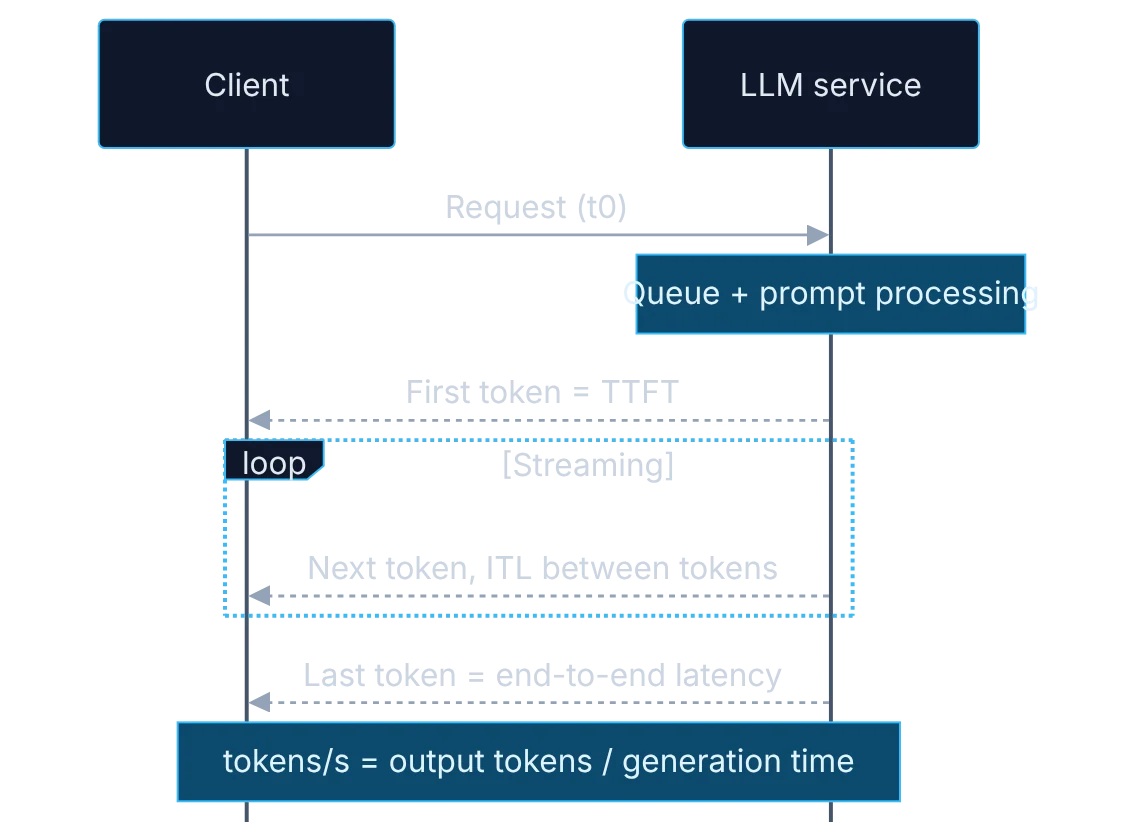
How it fits together
Show the diagram as text
client ──▶ service   request (t0)
              │      queue + prompt processing
client ◀── service   first token            = TTFT
client ◀── service   next tokens (streaming) = ITL between tokens
client ◀── service   last token             = end-to-end latency

tokens/s = output tokens / generation time
Requirements
- An OpenAI-compatible endpoint (local Ollama works).
- Python 3.10+.
Setup
pip install openai
python perf/ttft.py
import time
from openai import OpenAI
client = OpenAI(base_url="http://localhost:11434/v1", api_key="ollama")
t0 = time.perf_counter()
first = None
chunks = 0
stream = client.chat.completions.create(
model="llama3.2",
stream=True,
messages=[{"role": "user", "content": "Explain boundary value analysis in 120 words."}],
)
for event in stream:
if event.choices and event.choices[0].delta.content:
if first is None:
first = time.perf_counter()
chunks += 1
t1 = time.perf_counter()
print(f"TTFT {first - t0:.2f}s | total {t1 - t0:.2f}s | ~{chunks / (t1 - first):.1f} chunks/s")The metrics
- TTFT (time to first token): time until the first token. It's what the user feels as "it answered".
- ITL (inter-token latency): time between tokens. It measures how smooth streaming text is.
- Output tokens/s: generation speed. It's the system's real capacity.
- Total latency p95 and p99: the tail is what generates complaints.
- Error rate (429, 5xx, timeouts): quota limits and saturation.
- Goodput: percentage of requests meeting all targets at once.
- Cost per request: input and output tokens. Load is paid for too.
Step by step
1. Why classic metrics mislead
Understand why classic metrics mislead: two requests to the same endpoint can generate 20 or 2,000 tokens. Requests per second and average latency blend different things.
In a traditional API, requests to the same endpoint cost roughly the same. With a model, each request's cost depends on how many tokens go in and, above all, how many come out, because generation is sequential. Ten requests per second with short answers and with long answers are two completely different loads for the same server. If you report only requests per second and average latency, two tests with the same result may have measured different things.
2. The workload profile
Define the workload profile: prompt sizes, expected output length, streaming or not, and peak concurrency.
Before measuring, describe the real load. Which prompt sizes arrive and in what proportion. What answer length is expected. Whether streaming is used or the full answer is awaited. What peak concurrency is. Take this from production logs if they exist, or estimate it with the product team if not. A profile with three or four request types and their proportions is enough. Without a profile you'll test with an arbitrary prompt and get numbers that predict nothing.
3. Targets per percentile
Set targets per percentile, not average: for example TTFT p95, total latency p95 and a maximum error rate.
An average hides the tail, and the tail is where the complaining users are. Define targets as percentiles: for example, time to first token at the ninety-fifth percentile, total latency at the ninety-fifth percentile and a maximum error rate. The values come from the experience the product needs, not from what the system delivers today. Write them before measuring. If you define them afterwards, they'll look suspiciously like what you measured.
4. The single-user baseline
Measure the single-user baseline with the script. If you miss targets with one user, there's no load test to run yet.
Run the script with a single user and no concurrency, several times for each request type in the profile. That gives you the best case: what the system does when competing with nobody. If you miss targets with one user, there's no load test to run yet, because the problem lies in the chosen model, the prompt size or the infrastructure, and load will only make it worse. The baseline is also the reference for reading everything that comes next.
5. Goodput
Add goodput: the percentage of requests meeting all targets at once.
Goodput is the percentage of requests meeting all targets at once: first token on time, total latency within the limit and no error. It matters because the separate metrics can look fine while the experience is poor. A system can sustain many requests per second and have low goodput if a good share of them arrive late. It's the number that best sums up whether load is being served acceptably, and it's useful for comparing configurations.
6. Cost per request
Record cost per request. A load test against a paid API consumes real budget.
Record each request's input and output tokens and convert them into cost. It has two uses. The first is product-related: knowing what it costs to serve a user at the expected load. The second is practical. A load test against a paid API consumes real budget, and a badly sized test can spend in an hour what was planned for a month. Estimate the test's cost before running it and use a key with a spending cap.
Illustrative example
With illustrative values: a team defines three request types for its assistant, short, medium and long, in a sixty, thirty, ten proportion. The targets are first token in under a second and a half and total latency under twelve seconds, both at the ninety-fifth percentile. The single-user baseline shows the short and medium ones comply. The long ones take eighteen seconds in total, even though the first token arrives on time. Before any load test there's already a finding. They discuss it with product and agree to limit the length of those answers, which brings them to eleven seconds.
Common mistakes
- Reporting only requests per second and average latency.
- Testing with a single prompt that doesn't represent the real load.
- Setting targets after seeing the measurements.
- Launching a load test without estimating what it will cost.
Checklist: how to know it is done
- The workload profile has request types and proportions.
- Targets are written per percentile before measuring.
- There is a single-user baseline for each request type.
- Each measurement includes tokens and cost per request.
Where AI fell short
Assistants default to classic API metrics (RPS, averages). You have to explicitly ask for generation metrics.
Frequently asked questions
Which metric matters most?
It depends on the interface. With streaming, time to first token is what the user perceives as a response. Without streaming, total latency is all they see. In batch processes, throughput in tokens per second and cost weigh more.
Can I measure this against a local model?
Yes, and it's a good way to practice the method without spending. Absolute values will be very different from a cloud API's, but the metrics, the profile and the way of defining targets are the same.
What if I don't use streaming?
Time to first token stops being meaningful to the user and total latency becomes the main metric. It's still worth measuring on the server side: it helps separate time waiting in a queue from generation time.
Day 25 of 31 of the 31 days of QA + AI series. Commands and versions reviewed in November 2026: rerun them before relying on them, AI tooling changes fast.
← Previous: Security (3): prompt injection in tool-using agents and how to test the controls
Next: Performance (2): load testing an LLM endpoint with k6 →