Guide · QA + AI series · 18/31 · November 13, 2026 · 6 min read
How to test a model: accuracy, N runs and ranges
How to measure a decision-making model (an agent mapping messy names to a master catalog) with repeated runs, ranges and per-error-type metrics.
"Which model is best for this?" is a question almost always answered with a public leaderboard or the impression of whoever tried it one afternoon. Neither says how it will behave on your task, with your data and your prompt. And when someone does measure it, they usually do it with a single run and report a single number.
Testing a model seriously is closer to an experiment than to a test. There is a defined task, a fixed set, several repetitions and a result with its range. This guide uses a record-mapping case to show the full method: what to measure besides accuracy, how to tell a real difference from noise and how to decide when the most expensive model isn't clearly the best. The figures shown are illustrative.
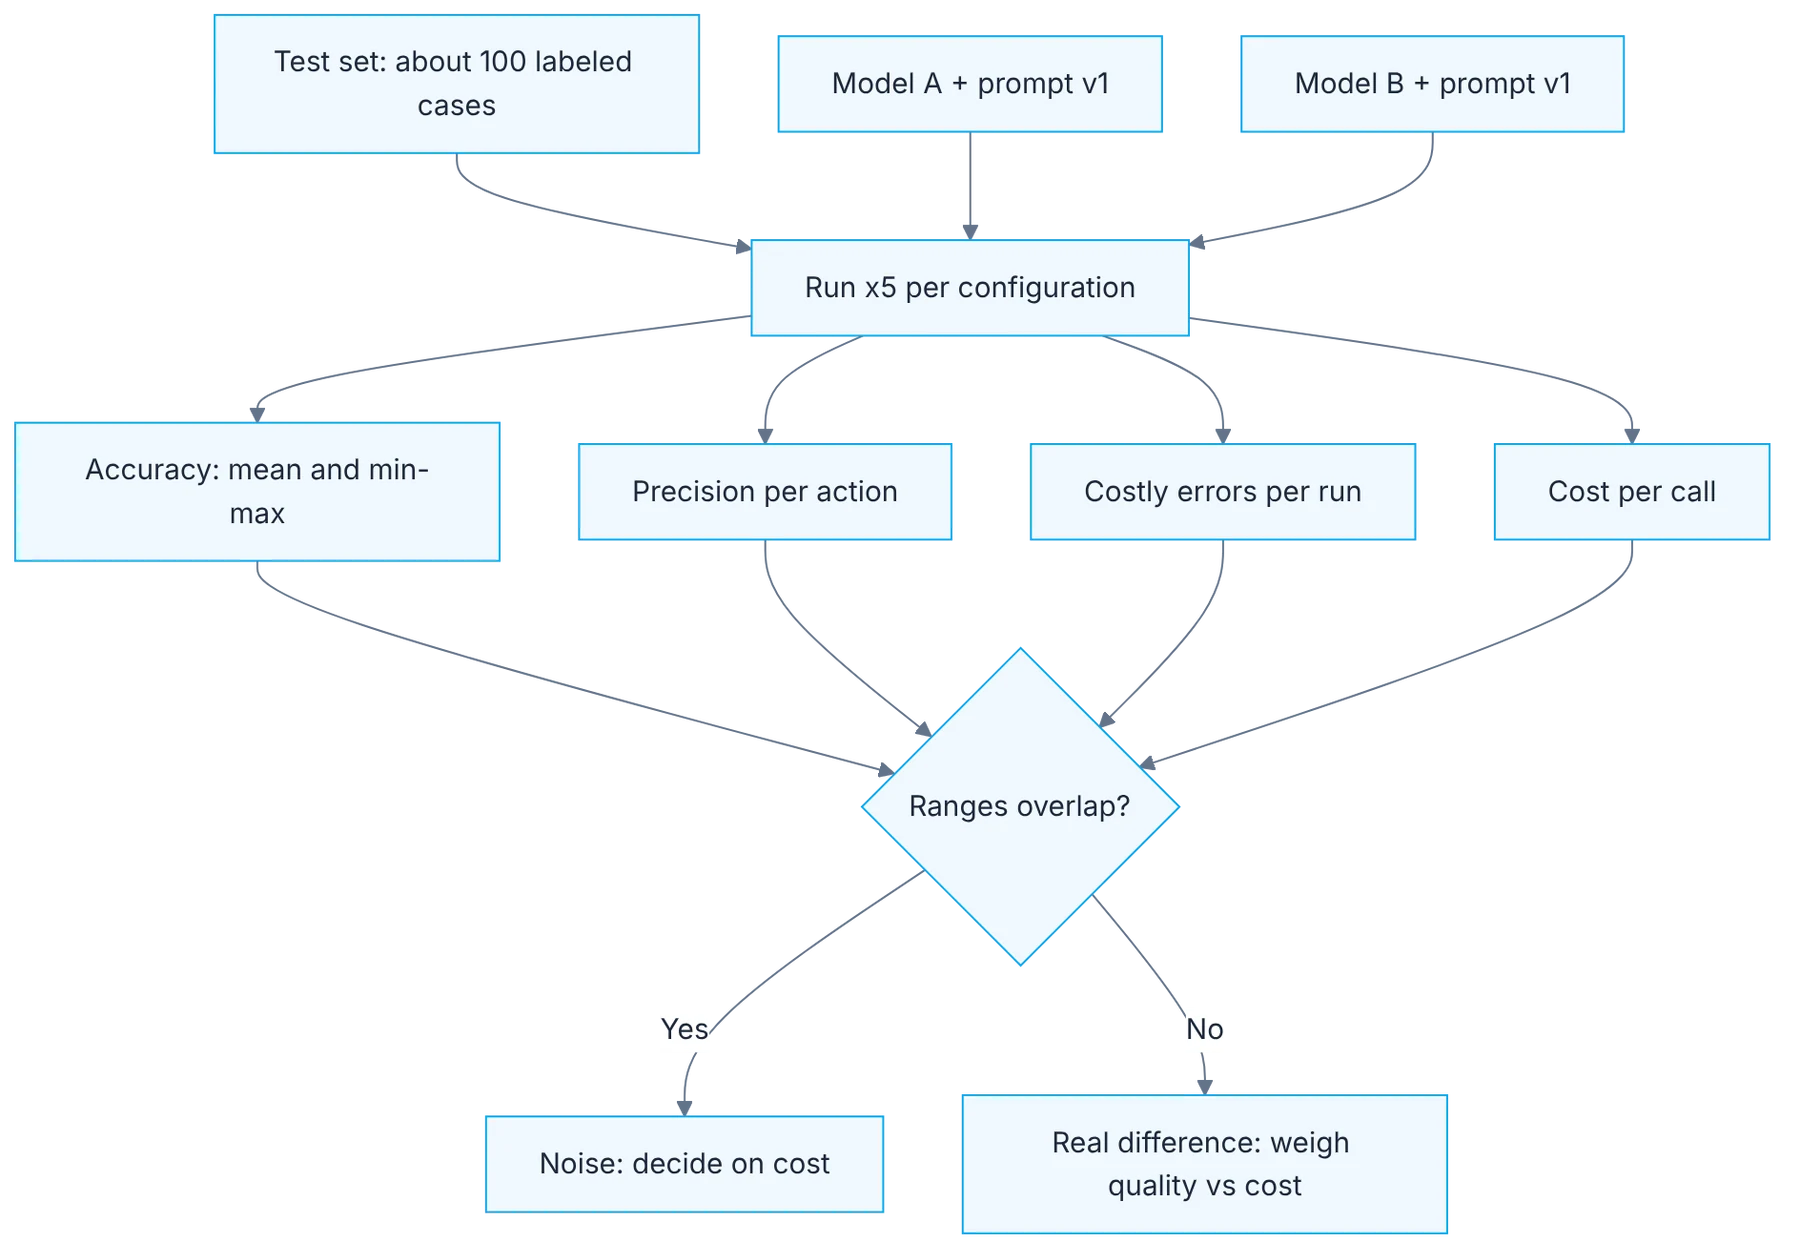
How it fits together
Show the diagram as text
test set (~100 labeled cases)
   ▼
run x5 per configuration (model A · model B, same prompt)
   ├─ accuracy: mean and min-max
   ├─ precision per action
   ├─ costly errors per run
   └─ cost per call
   ▼
ranges overlap?
   ├─ yes ▶ the difference is noise: decide on cost
   └─ no  ▶ real difference: weigh quality against cost
Requirements
- The golden dataset from day 17 (about 100 test cases).
- An eval harness with a pinned model version (days 8 and 15).
Setup
npx promptfoo eval -c evals/mapping.yaml --repeat 5 -o results/run.jsonconfig accuracy mean (min-max) costly errors / run precision map_to_existing cost / call
model A, prompt v1 71% (68-75) 4.0 85% low
model B, prompt v1 70% (66-74) 3.6 86% several times moreStep by step
1. Task and actions defined
Define the task and possible actions precisely. In this case: map to an existing record, approve as new or send to review.
Write down precisely what the model receives and which are the only valid outputs. In the sample case a new record arrives and there are three possible actions: map it to an existing one, approve it as new or send it to human review. Defining the actions as a closed list makes the task measurable. It also forces a decision on what is expected in each doubtful situation. If the definition is vague, you'll be measuring the model's interpretation and not its capability.
2. Five runs per configuration
Run each configuration 5 times on the same test set. A single run isn't a measurement.
Run each configuration five times on the same test set, changing nothing between runs. The same model on the same input can move several points from one run to the next. If you measure once, you don't know whether you saw its best day, its worst or a typical one. Five repetitions is a reasonable trade-off between cost and information. If results come out widely spread, that spread is already a finding about the model's stability on your task.
3. Mean and range
Report mean and range (min and max). If two configurations overlap in range, the difference is noise.
Report the mean together with the minimum and maximum of the five runs. Then apply a simple rule: if the ranges of two configurations overlap, you can't claim one is better. That difference is compatible with noise. Many decisions to switch model or prompt are made on one- or two-point differences that vanish when the measurement is repeated. Showing the range in the table avoids that argument before it starts.
4. Beyond accuracy
Look beyond accuracy: per-action precision and number of costly errors per run. A wrong map to an existing record pollutes data; over-sending to review only costs time.
Accuracy treats all errors as equal, and they aren't. In the example, mapping a record to an existing one that doesn't correspond pollutes the data and is hard to detect later. Over-sending to review only costs a person's time. That's why it's worth looking at per-action precision and, above all, counting costly errors per run. A model with slightly lower accuracy and half the costly errors may be the best choice.
5. Same conditions, quality against cost
Compare models with the same prompt and dataset, quality against cost per call.
To compare models, hold everything else fixed: the same prompt, the same dataset, the same parameters and the same judge if there is one. Add cost per call and latency to the table. The useful comparison isn't which model has the highest number but how much additional quality you get per unit of cost. Sometimes that additional quality exists, and sometimes it sits within the noise margin, at several times the price.
6. Decide with the full table
Decide with the full table. The most expensive model doesn't always win, and sometimes wins by less than the noise.
The decision comes from reading all the columns together: mean, range, costly errors, cost and latency. The most expensive doesn't always win, and when it does it may win by less than the noise. Leave the decision in writing together with the table and the run card. Three months from now, when a new model comes out, you'll be able to repeat exactly the same experiment and compare against a reference of your own, instead of starting the discussion from zero.
Illustrative example
With made-up figures to illustrate the method: a team compares three configurations on forty test cases, five runs each. The small model averages 71% with a range of 68 to 75 and six costly errors per run. The medium one, 84% with a range of 81 to 86 and two costly errors. The large one, 85% with a range of 82 to 88, also two costly errors and five times the cost of the medium one. The medium and large ranges overlap almost entirely, so the one-point difference isn't evidence. They choose the medium one and document that the large one didn't justify its cost on this task.
Common mistakes
- Deciding with a single run per model.
- Reporting a mean without its range.
- Looking only at accuracy when errors have different costs.
- Comparing models with different prompts or datasets.
Checklist: how to know it is done
- The task has a closed list of valid actions.
- Each configuration ran five times on the same test set.
- The table shows mean, range, costly errors, cost and latency.
- The decision is written down next to the table and the run card.
Where AI fell short
The same model on the same input varies several points between runs, and some models fail outright on large contexts. A single number doesn't describe a model.
Frequently asked questions
Are five runs enough to claim something with statistical rigor?
They're enough for a practical rule: discarding differences that fall within the range. For high-impact decisions, add runs and cases and use a formal statistical test. What never works is a single run.
Aren't public benchmarks enough?
They help build a shortlist of candidates. They don't say how a model performs with your prompt, your output format and your hard cases. The final decision comes from your dataset.
What do I do if a model fails outright on large inputs?
Record it as a result, don't discard it silently. A model that can't process the context your task needs is out for that reason, and that's a valid conclusion of the experiment.
Day 18 of 31 of the 31 days of QA + AI series. Commands and versions reviewed in November 2026: rerun them before relying on them, AI tooling changes fast.
← Previous: Golden datasets: how to label, balance and version
Next: Cost as a quality metric: top-K prefiltering before the model →